
Come plottare dei dati in una window usando seaborn e matplotlib
Di seguito un piccolo esempio utile per capire come salvare su file e plottare in una finestra dei dati con matplotlib elaborati tramite seaborn.
import matplotlib.pyplot as plt
import numpy as np
import pandas as pd
import seaborn as sns
import sys

def create_random_pandas_dataframe():

    """Create a random pandas dataframe"""

    df = pd.DataFrame(np.random.randint(0, 100, size=(100, 4)), columns=list('ABCD'))

    return df

# Read in the data

if len(sys.argv) > 1:

    df = pd.read_csv(sys.argv[1])

else:

    df = create_random_pandas_dataframe()

    print(df)

# Plot the data

sns.set_style('whitegrid')

sns.set_palette('colorblind')

sns.pairplot(df)

# Save the plot

plt.savefig('test_sns.png')

# Show the plot

plt.show()
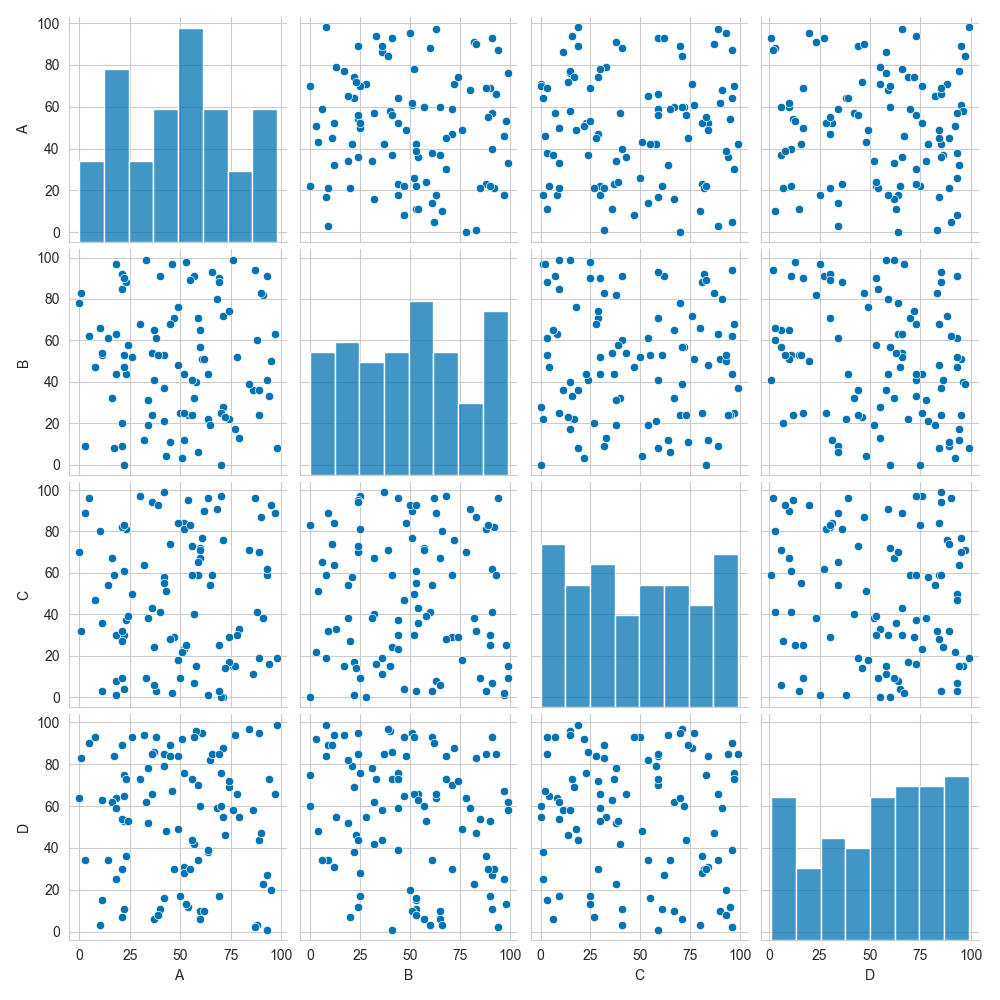
di seguito il risultato dell’esempio:

Sono amante della tecnologia e delle tante sfumature del mondo IT, ho partecipato, sin dai primi anni di università ad importanti progetti in ambito Internet proseguendo, negli anni, allo startup, sviluppo e direzione di diverse aziende; Nei primi anni di carriera ho lavorato come consulente nel mondo dell’IT italiano, partecipando attivamente a progetti nazionali ed internazionali per realtà quali Ericsson, Telecom, Tin.it, Accenture, Tiscali, CNR. Dal 2010 mi occupo di startup mediante una delle mie società techintouch S.r.l che grazie alla collaborazione con la Digital Magics SpA, di cui sono Partner la Campania, mi occupo di supportare ed accelerare aziende del territorio .
Attualmente ricopro le cariche di :
– CTO MareGroup
– CTO Innoida
– Co-CEO in Techintouch s.r.l.
– Board member in StepFund GP SA
Manager ed imprenditore dal 2000 sono stato,
CEO e founder di Eclettica S.r.l. , Società specializzata in sviluppo software e System Integration
Partner per la Campania di Digital Magics S.p.A.
CTO e co-founder di Nexsoft S.p.A, società specializzata nella Consulenza di Servizi in ambito Informatico e sviluppo di soluzioni di System Integration, CTO della ITsys S.r.l. Società specializzata nella gestione di sistemi IT per la quale ho partecipato attivamente alla fase di startup.
Sognatore da sempre, curioso di novità ed alla ricerca di “nuovi mondi da esplorare“.

Comments