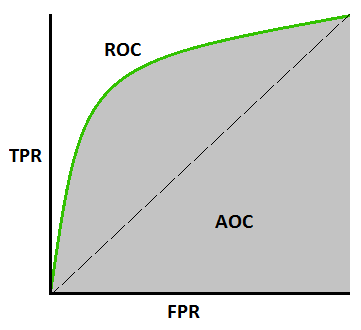
Let’s start with a formal definition: The ROC (Receiver Operating Characteristic curve) is a curve that shows the performance of a classification model at various probability thresholds. AUC stands for (Area Under The Curve) and measures the entire two-dimensional area under the entire ROC curve from (0,0) to (1,1), illustrated in grey.
Before delving into understanding what AUC-ROC is and how to plot it, we must examine other metrics that will be used to trace the curve in question.
In particular, we need to understand and know the Recall or TPR (True Positive Rate) metric, also known as Sensitivity, and its dual FPR (False Positive Rate) = 1 – Sensitivity.
The ROC graph is therefore obtained by plotting FPR and TPR on the Cartesian reference system, where FPR (False Positive Rate) is plotted on the x-axis and TPR (True Positive Rate) is plotted on the y-axis for different probability threshold values ranging from 0.0 to 1.0.
In conclusion, if we were to carry out inference tests on our sample DATASET with the aim of calculating the total value of TPR and FPR as the evaluation threshold changes on a binary classification, we would obtain our AUROC.
Let’s remember that (see my previous article):
Recall indicates how capable the system is to judge positively (it actually indicates the system’s ability to find possible positive cases in our best predictions) and is expressed as the ratio between True Positive (correct answers) and the sum of True Positive (correct answers) and False Negative (network responses considered negative when they are actually positive) in other words:
It refers to the ratio of the correctly predicted positive predictions over all the positive labels while:
It refers to the ratio of the incorrectly predicted positive predictions over all the negative labels.
What do FP, FN, TP, TN indicate?
True Negative (TN) occurs when the prediction is 0 and the true class is actually 0, i.e. we correctly predict that the class is negative (0).
False Negative (FN) occurs when the prediction is 0 while the true class is actually 1, i.e. we incorrectly predict that the class is negative (0).
False Positive (FP) occurs when the prediction is 1 while the true class is actually 0, i.e. we incorrectly predict that the class is positive (1).
True Positive (TP) occurs when the prediction is 1 while the true class is actually 1, i.e. we correctly predict that the class is positive (1).
An elegant way to plot the metrics just described and have an immediate view of the quality of the classifier is to use the confusion matrix.


I am passionate about technology and the many nuances of the IT world. Since my early university years, I have participated in significant Internet-related projects. Over the years, I have been involved in the startup, development, and management of several companies. In the early stages of my career, I worked as a consultant in the Italian IT sector, actively participating in national and international projects for companies such as Ericsson, Telecom, Tin.it, Accenture, Tiscali, and CNR. Since 2010, I have been involved in startups through one of my companies, Techintouch S.r.l. Thanks to the collaboration with Digital Magics SpA, of which I am a partner in Campania, I support and accelerate local businesses.
Currently, I hold the positions of:
CTO at MareGroup
CTO at Innoida
Co-CEO at Techintouch s.r.l.
Board member at StepFund GP SA
A manager and entrepreneur since 2000, I have been:
CEO and founder of Eclettica S.r.l., a company specializing in software development and System Integration
Partner for Campania at Digital Magics S.p.A.
CTO and co-founder of Nexsoft S.p.A, a company specializing in IT service consulting and System Integration solution development
CTO of ITsys S.r.l., a company specializing in IT system management, where I actively participated in the startup phase.
I have always been a dreamer, curious about new things, and in search of “new worlds to explore.”

Comments