
What is the correlation matrix? How is it constructed in Python?
What is the correlation matrix? To answer this question, let’s start with a definition:
The correlation matrix is a square table that reports the correlation indices between two or more variables inside.
Before delving into how to construct a correlation matrix and how to read it, let’s recall the concept of Correlation and understand its meaning.
What is correlation?
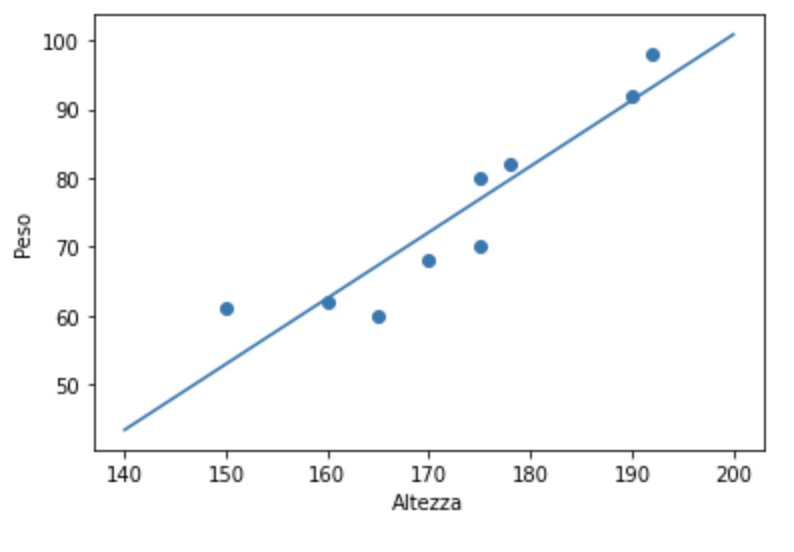
Correlation is a statistical measure that expresses the relationship between two variables and indicates the tendency of two variables (X and Y) to vary together, that is, to “covary”. For example, one might assume a relationship between an individual’s weight and height, meaning that as height increases, weight also increases.
Correlations can be Linear and Non-Linear.
Linear Correlation
The relationship is linear if the trend between the two observed variables, on a Cartesian axis system, takes the form of a straight line. In this case, as X increases (or decreases), Y increases (decreases). For example, as a person’s height increases, so does their weight.
Non-Linear Correlation
The relationship is non-linear if, when represented on Cartesian axes, it has a curvilinear trend (parabola or hyperbola). In this case, low and high levels of X correspond to low levels of Y; whereas intermediate levels of X correspond to high levels of Y.
Form of correlation
Regarding the form of the relationship, we distinguish between magnitude and direction.
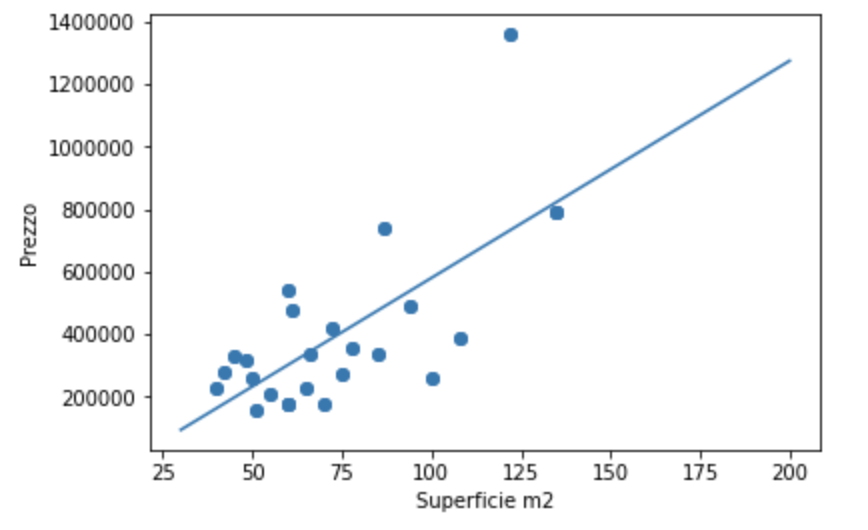
The direction is positive if, as one variable increases, the other also increases. For example, as the surface area increases, the property’s price also increases.
The direction is, on the other hand, negative if, as one variable increases, the other decreases, for example, as the production of a product increases, the product’s price generally decreases. In practice, as supply increases, the price drops.
Another way to differentiate correlations is by observing the magnitude, i.e., the strength of the existing relationship between two variables. The magnitude explains how strong the correlation is by observing the points in the dispersion space, in practice, the more the scores are grouped around a straight line, the stronger the relationship between two variables.
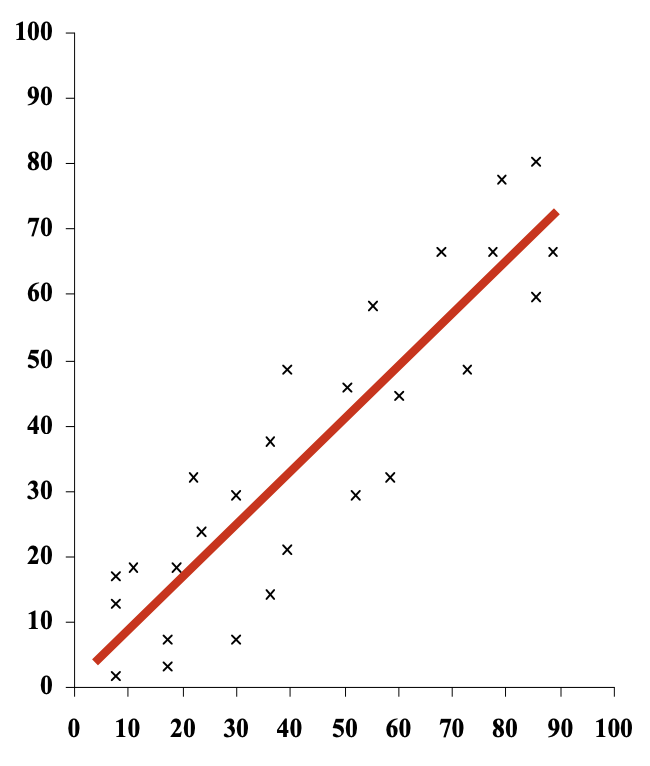
If the scores are dispersed uniformly, however, there is no relationship between the two variables.

How is it measured?
To express the existing relationship between two variables, in terms of magnitude and direction, the correlation coefficient is used. This coefficient is standardized and can take values ranging from -1.00 (perfect negative correlation) to +1.00 (perfect positive correlation). A correlation equal to 0 indicates that there is no relationship between the two variables.
What limitations does correlation analysis have?
Correlation cannot verify the presence or effect of other variables other than the two under consideration. In particular, it tells us nothing about cause and effect.
Correlation coefficients
The correlation is described by a value that does not have a specific unit of measure, called the correlation coefficient, ranging between -1 and +1 and denoted by r.
Referring to the correlation index r we can state that:
- The closer **r** is to zero, the weaker the linear correlation.
- A positive **r** value indicates a positive correlation, where the values of the two variables tend to increase in parallel.
- A negative **r** value indicates a negative correlation, where the value of one variable tends to increase as the other decreases.
Various correlation coefficients have been formulated depending on the scale of the variable, in particular, we must remember:
- For equivalent interval or ratio scales, the **Pearson r** coefficient is used.
- For ordinal scales, the **Spearman rs** coefficient or the **Kendall tau** coefficient is used.
- For categorical (dichotomous) scales, the **rphi coefficient** or the **rpbi coefficient** is used.

I am passionate about technology and the many nuances of the IT world. Since my early university years, I have participated in significant Internet-related projects. Over the years, I have been involved in the startup, development, and management of several companies. In the early stages of my career, I worked as a consultant in the Italian IT sector, actively participating in national and international projects for companies such as Ericsson, Telecom, Tin.it, Accenture, Tiscali, and CNR. Since 2010, I have been involved in startups through one of my companies, Techintouch S.r.l. Thanks to the collaboration with Digital Magics SpA, of which I am a partner in Campania, I support and accelerate local businesses.
Currently, I hold the positions of:
CTO at MareGroup
CTO at Innoida
Co-CEO at Techintouch s.r.l.
Board member at StepFund GP SA
A manager and entrepreneur since 2000, I have been:
CEO and founder of Eclettica S.r.l., a company specializing in software development and System Integration
Partner for Campania at Digital Magics S.p.A.
CTO and co-founder of Nexsoft S.p.A, a company specializing in IT service consulting and System Integration solution development
CTO of ITsys S.r.l., a company specializing in IT system management, where I actively participated in the startup phase.
I have always been a dreamer, curious about new things, and in search of “new worlds to explore.”
